By Sean Bonner | Director
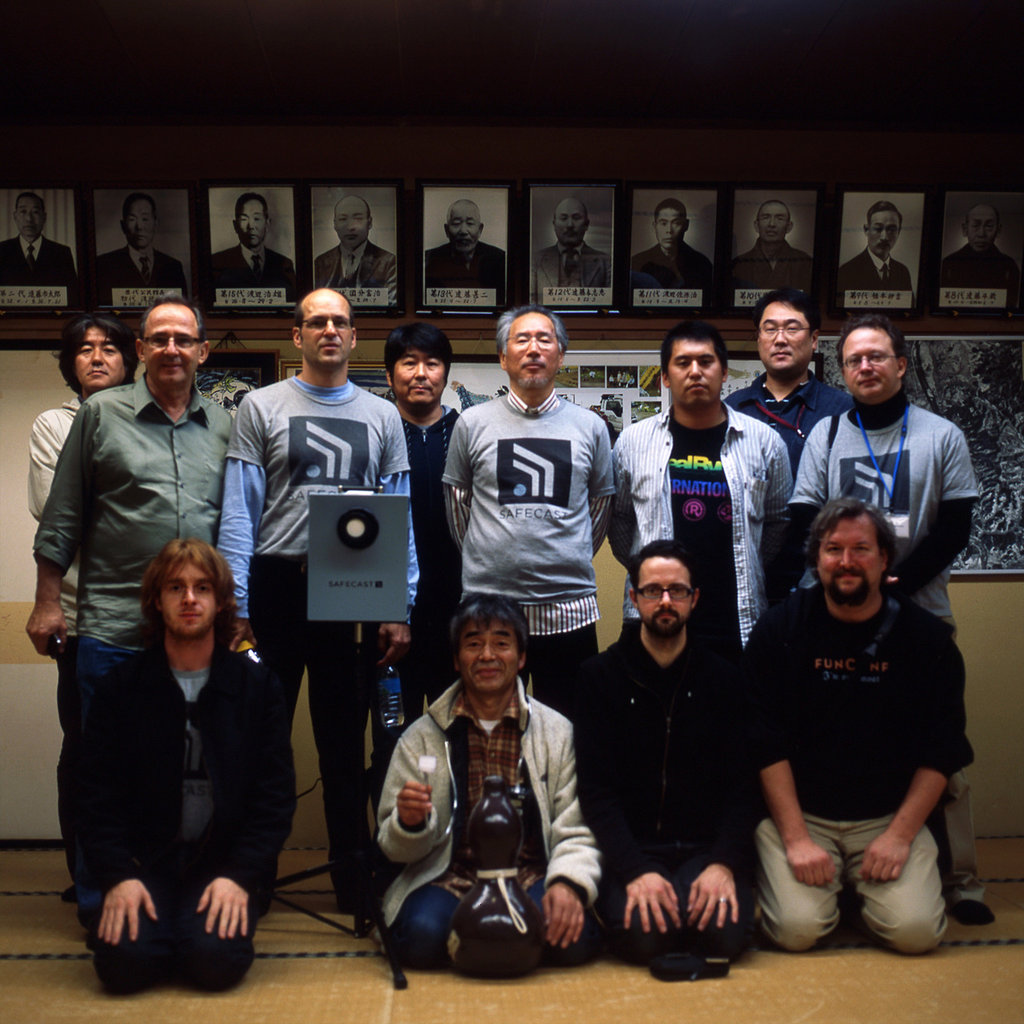
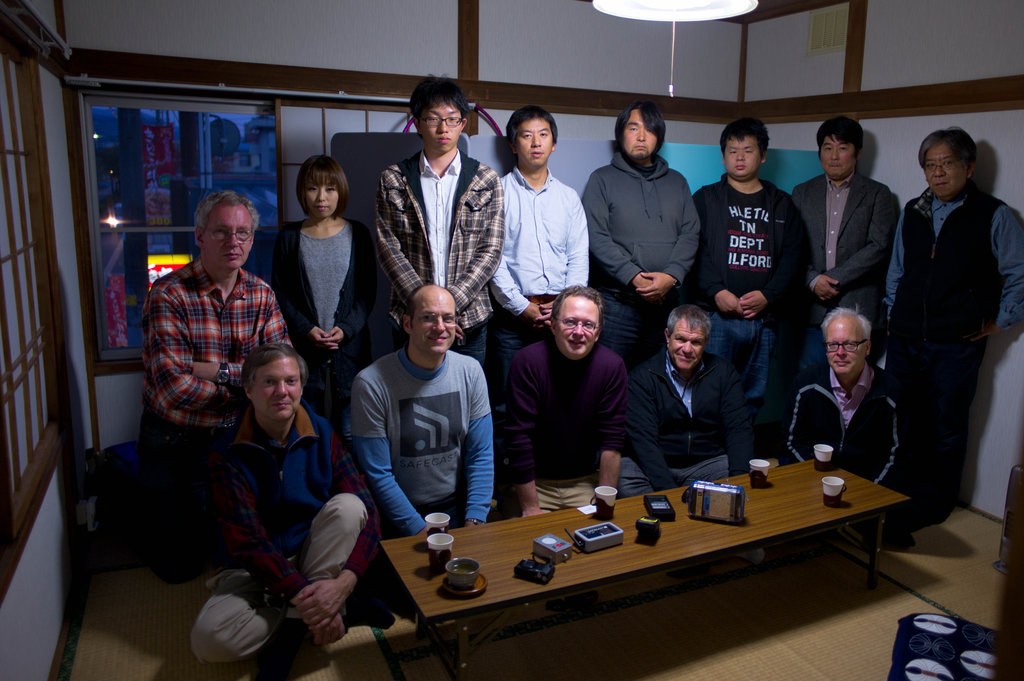
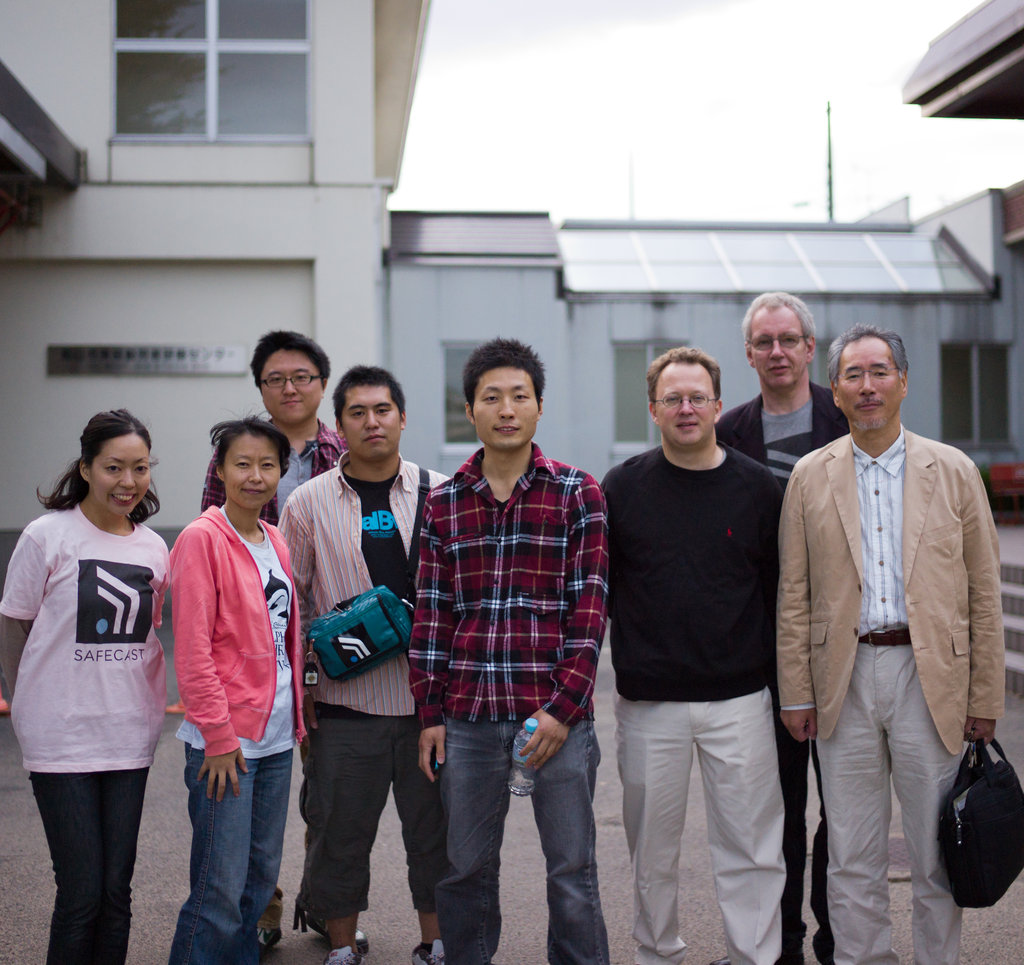
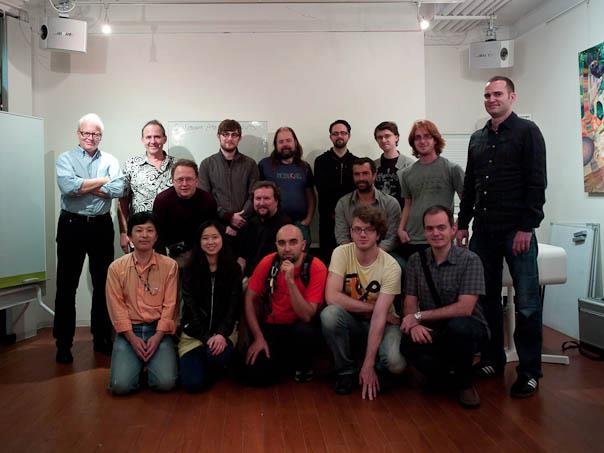
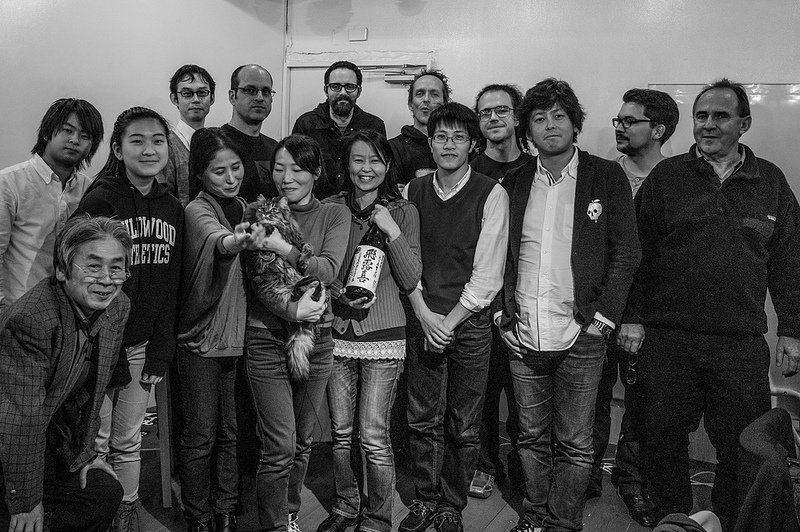
We're just back from our 2nd hackathon of the year. We're trying to do each hackathon in a different city so that it's accessible to different people each time. In January we met in Tokyo, and last month we met in Boston (Cambridge actually, with the support of MIT). In January we spent a week working on anything and everything and while we got a lot done, admittedly it was a bit chaotic. For this event we wanted to focus the efforts a little more while still addressing a number of issues.
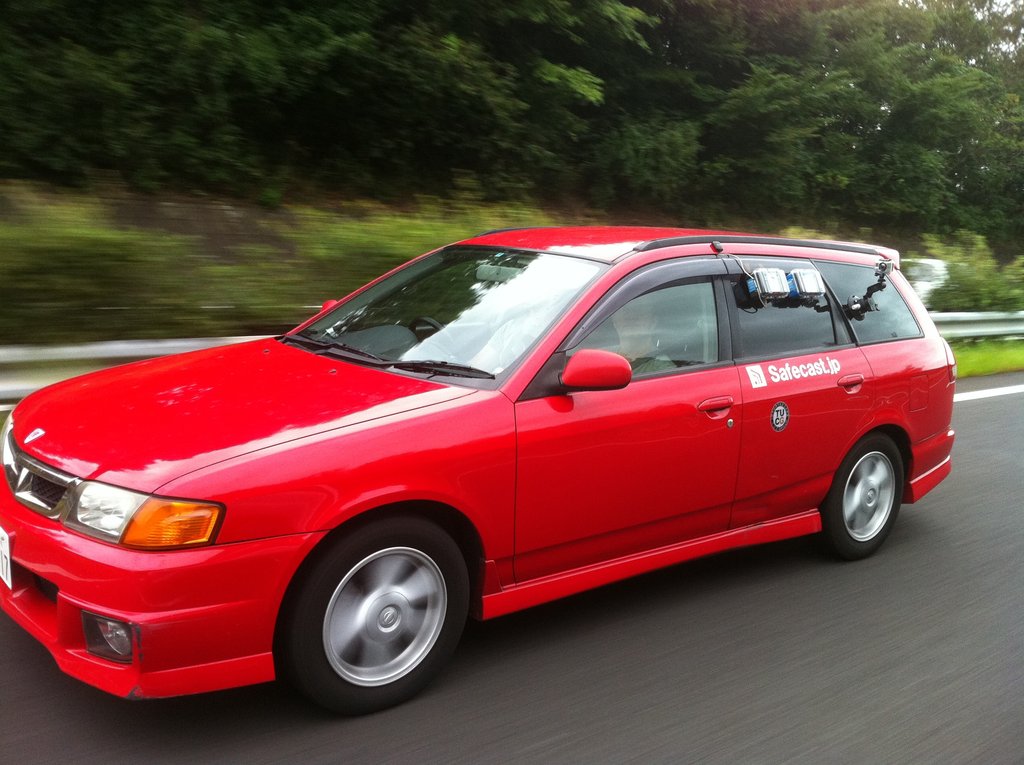
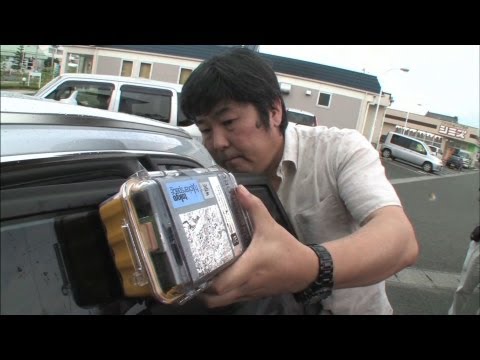
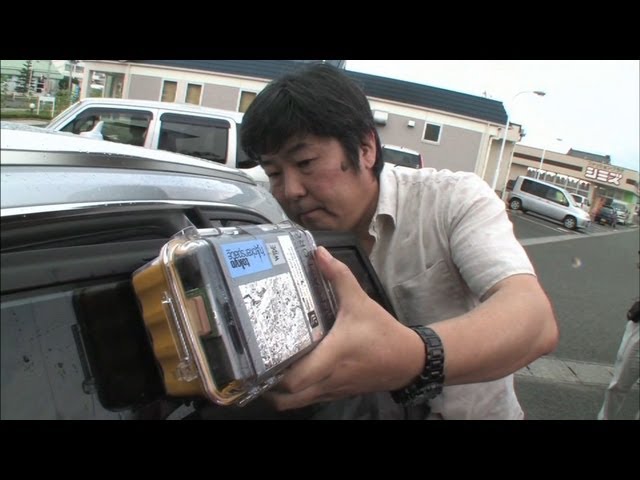
We decided to begin work on the "Safecast Air Force" or drone program as the focal point for this.
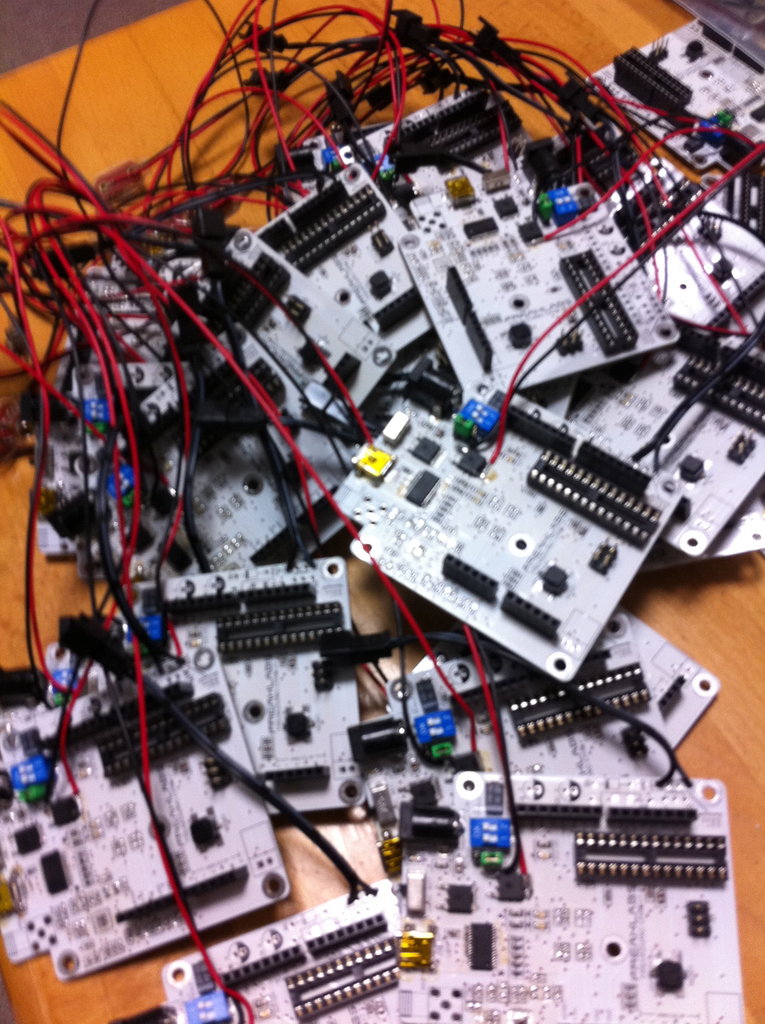
Drones are interesting for a number of obvious reasons, but for our purposes if we have a device that we can send out with any number of sensors onboard that can scan an area that is unsafe or unnavigable - that's huge. So that's what we focused on for the week. In doing so, it allowed us to think about how to made our sensors a bit more modular (swap out radiation for air quality, etc), how best to transfer data (keep onboard, or broadcast - using SMS or wifi, etc) and how to display data taking at altitude in relation to data taking at ground level.
All serious issues outside of the context of a drone, but within it that much more interesting. Which can be important with a volunteer team. :)
We started the week with nothing and by the end of the week had a drone with a bGeigie attached logging data as it flew. We tried a number of different off the shelf drone platforms and made quite some progress in deciding which direction we'd continue to work. There are a number of videos of our test flights that you can watch here:
https://www.youtube.com/user/levisimons
All in all it was a very productive hackathon. As always, stay tuned to our blog and mailing lists for more regular updates as they happen. Thanks!
By Sean Bonner | Director of Global Operations
By Sean Bonner | Director of Global Operations
Project reports on GlobalGiving are posted directly to globalgiving.org by Project Leaders as they are completed, generally every 3-4 months. To protect the integrity of these documents, GlobalGiving does not alter them; therefore you may find some language or formatting issues.
If you donate to this project or have donated to this project, you can receive an email when this project posts a report. You can also subscribe for reports without donating.