Starting to measure your nonprofit’s activities and communicate about them effectively is hard. Learn how your organization can use basic data to illustrate its impact.
As a nonprofit leader, you know that your work is important to your community. But communicating that story can be harder than you might expect. Many nonprofit organizations make the mistake of describing their work with abstract language or generalities, leaving out the specific details needed for the message to resonate with their supporters. Using your organization’s data to fill these gaps can be a great way to address this problem.
Data doesn’t have to be intimidating. You’re probably already collecting data, but you might not realize it. For example, you might have records on how many program participants you have per month, how much material has been ordered for new participants, or written feedback from your community about how much they liked or disliked a particular program. So how do we begin to make sense of it all?
First, there are two categories of data: quantitative and qualitative.
Quantitative data uses numbers to describe something. It answers questions like: How many pounds of food were distributed? What percentage of training attendees meet learning goals? What is the ratio of animals to attending volunteers in your organization’s care?
Qualitative data, on the other hand, uses words to capture information and can help answer questions that numbers can’t effectively measure. For example: Why do your program participants use your services, and how have they benefited from them? How does participation in your program during childhood influence a person’s path to adulthood?
Quantitative and qualitative data can also overlap. You may conduct surveys and record narratives about how your program’s participants are benefiting from your work (qualitative data) while counting what proportion of participants’ narratives fall into certain categories or themes (quantitative data).
Here are some ways your nonprofit can use basic data collection to share the details of your impact with different key audiences:
You might use data collected from your community before and after receiving your programming to help decide whether your programming influences your target group’s outcomes. When collected at regular intervals, good data allows your organization to identify and make needed changes to your programs sooner. And it can show your organization which programs are working well and worth expanding. However, remember to watch out for common biases that could affect your conclusions—like confirmation bias, which might cause you to look for certain data and analyze it in a way that proves you right. Here’s an example:
Instead of this: We provide sanitary pads and health training to girls. After our programs, young girls stay in school, find better jobs, and improve their livelihoods.
Try this: In 2018, 20% of girls in our community dropped out before completing middle school. In 2019, we provided monthly supplies of sanitary pads to 30 girls at this school, accompanied by monthly after-school health classes. One year later, 28 of these girls were still in school. When asked what factors helped them to stay in school, 15 of those 28 girls mentioned better attendance—no longer missing school for one week per month.
Many funders want to promote the return on investment that their gifts to organizations like yours will generate. Collecting and reporting data about your organization’s work will give funders a detailed view of the benefit that your work provides in your community over time. It will also reassure your funders that you are providing up-to-date information. Here’s an example:
Instead of this: We rescued and treated injured dogs and educated our community about the importance of stopping animal abuse.
Try this: From October to December 2019, we rescued and treated five stray dogs. Through twice-monthly workshops, we educated 60 people in our community about animal abuse and what to do when they see it. In survey responses one week after the training, at least 20 of the 60 participants said the training changed the way they think about the animals they see on the street every day.
What questions will help your nonprofit focus on its mission when making decisions about its programs and events? Collecting and exploring data about your current work can help you find out. Here’s an example:
Instead of this: The number of applicants for your theater programs each summer has been steadily increasing for the past three years, and you assume that the only option you have to meet the demand is to increase the number of classes.
Try this: Analyze your enrollment log and survey students and parents in your existing programs. Are the students in your programs exclusively interested in theater, or are they also interested in music or dance? Are students satisfied with the size of the class, or would their parents be willing to pay higher fees for smaller class sizes?
Stories paired with data make your message powerful. The story of one individual may be a compelling description of how and why your programs operate. But when backed up with data showing that other individuals are affected in similar ways, you can demonstrate the impact of your programming across your community. Analyzing collective data also makes you more aware of potential unintended consequences of your work. Here’s an example:
Instead of this: After one of our girls told us about the community’s need for computer skills training, we started offering computer classes at her school.
Try this: After one of our girls told us about the community’s need for computer skills training, we surveyed 20 of her classmates (10 girls and 10 boys) and 20 local parents. The survey results showed that most individuals considered computer skills training a top priority. We then decided to offer computer classes at the school and even open classes for parents! When observing our classes, we noticed that the children learn new material faster than their parents, so we adapted our teaching style to make sure the parents have the support they need to succeed.
You’ll notice that these examples focus on the changes experienced (what we call outcomes) by each group, rather than just counting the programs or services provided (outputs). If you’re able to collect data on the outcomes your organization causes, it often provides a more complete picture of your work.
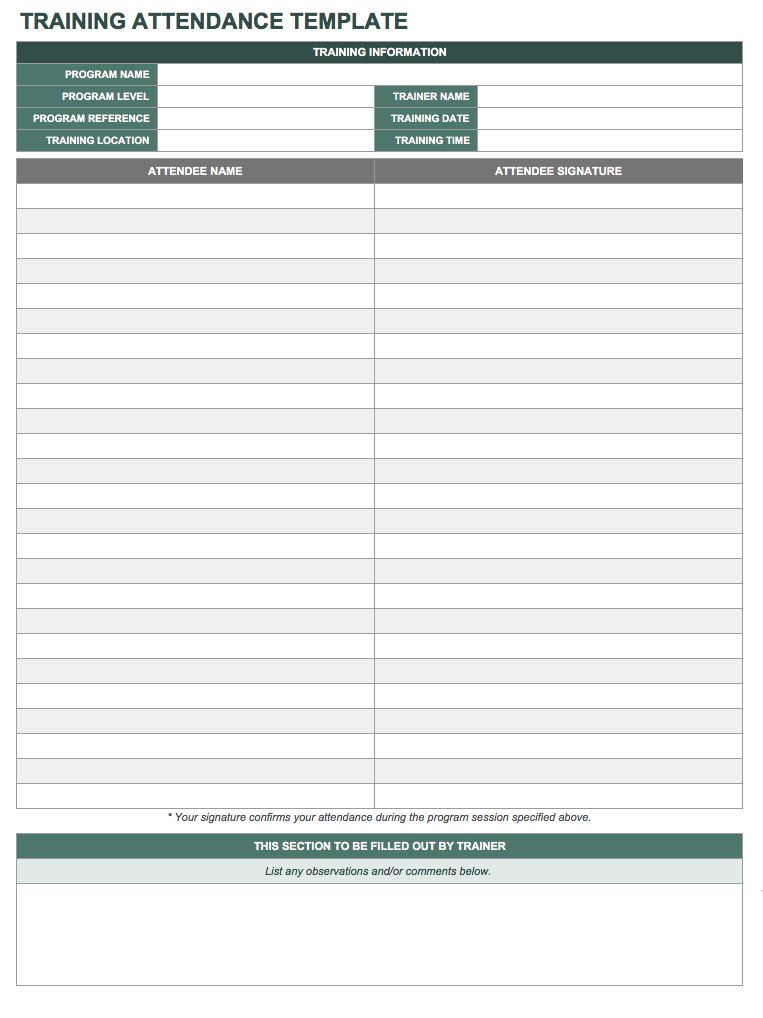
Here are some tools to get your team started with data to capture and understand the details of your programs:
Find exactly what you're looking for in our Learn Library by searching for specific words or phrases related to the content you need.


